VOC-chart of the Atlantic Ocean by Isaak de Graaf
Navigating with an 18th century satnav
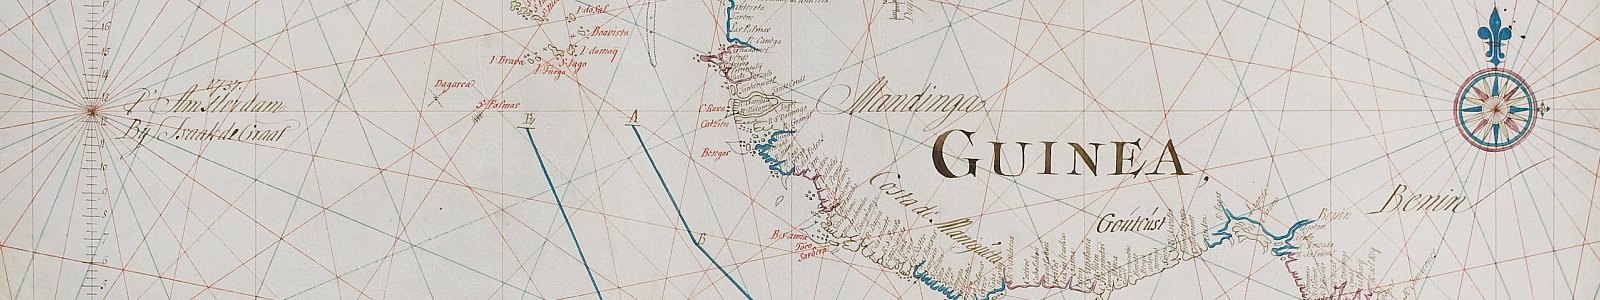
The Dutch East India Company map shown here belongs in the ‘passage charts’ or 'overzeilers' category. The compass chart shows a large portion of the Atlantic Ocean and was intended to help sailors 'find passage' across this ocean. On the journey to East India this was one of the first manuscript maps on vellum to be used by master mariners.

For journeys from Holland via the Channel or around the north coast of England mariners used printed maps. From Cape Finisterre ships then headed in a south-westerly direction to Madeira and the Canary Islands. After that they called in at the Cape Verdi islands and set a course in a south-easterly direction to a zone with variable winds. There mariners had to follow precise instructions:
‘Op dat nu met de veranderlyke winden niet te verre naar den eene of den anderen kant zoude worden gestevent, maar dat de Linie [= equator] op het bekwaamst zal worden gekruyst, zyn in de Paskaart getekent de Puncten A.B.C.D.E.F.G.H en I’. These points are shown on the compass chart of the Atlantic Ocean.
Dangerous currents

The so-called ‘wheel track’ which is created by the link between the letters A to G is clearly visible.
Master mariners had to ensure that they did not end up to the east of the ABC line which was where the dangerous currents from the Gulf of Guinea were lurking. On the other hand they had to go no further to the west than the ED line, thereby keeping the Brazilian coast at a safe distance.
Once through the ‘wheel track’ and past the equator the journey continued via the south-easterly trade winds to the westerly winds zone. Eventually they would reach the Cape of Good Hope via a set easterly course. That is where the ships of the Dutch East India Company were restocked. Eventually the ships would sail via the Indian Ocean and Sunda or Bali Straits to the final destination of Java.
Navigating by points of the compass

The general geographical names on the mainland of the Atlantic Ocean compass chart are written in black ink. The red place names refer to the presence of Dutch East India Company locations.
The straight lines on the chart are points of the compass which helped master mariners navigate and plan the sailing route. The points of the compass meet in the central compass rose which is characteristic of sea charts. Around that, complete compass charts generally have sixteen secondary compass roses which are all linked by lines.
This creates a network of so-called rhumb lines which are lines which make a right angle with all meridians and which make it possible to navigate using a fixed compass point.
Reliable charts for the Dutch East India Company
The Dutch East India Company, which was set up in 1602, was a private trading company which, in a short space of time, developed into the largest shipping company in the world. In its heyday the company had a fleet of more than 100 ships, ten thousand employees and a huge number of warehouses in the Netherlands and abroad. The trading empire extended from the Cape of Good Hope to Japan and China.
Sound knowledge of the geographical and nautical condition of the sailing routes and trade areas was, of course, extremely important to the Dutch East India Company. That is why reliable charts were made in cartographic workshops.
Master mariners used these charts as a kind of 17th and 18th century navigation system to plan their route to the East. Small-scale outline maps for navigating the open sea – also referred to as ‘passage charts’ or 'overzeilers' – guided the master mariners across the Atlantic and Indian Oceans. Large-scale detailed charts were intended to ensure safe navigation out of Holland, through the Channel and the inland waterways of the Indian Archipelago.

Vellum: strong and resistant to all kinds of weather
The Dutch East India Company was a well organised company with strict rules on equipping ships. Lists were kept of the navigation material that had to be taken on-board. The master mariner and petty officers had to sign to show they had received the material in question. They also had to undertake to surrender the material upon arrival in Batavia. On board each Dutch East India Company ship there were paper and vellum maps and charts. Created from animal skin, vellum is strong and withstands weather and frequent use well. Dutch East India Company charts on vellum were almost always drawn by hand.
The ravages of time...
Recent figures show that between 1602 and 1753 – the year that the Dutch East India Company switched exclusively to printed charts – around 70,000 parchment charts had been produced for the company. Of these only a couple of dozen are kept in public Dutch collections and worldwide only a couple of hundred.
The collection of maps at the Utrecht University Library currently comprises six valuable Dutch East India Company charts on vellum, all made by Isaak de Graaf who was chief map maker at the Amsterdam chamber between 1705 and 1743. In addition to the map of the Atlantic Ocean shown here, there are also compass charts of Sumatra, the Sunda Strait, the Java Sea (two copies) and the northern coast of Java.
The library therefore has five of the seven standard charts on vellum which were used on board the East Indies fleet in the first half of the 18th century.
Author
