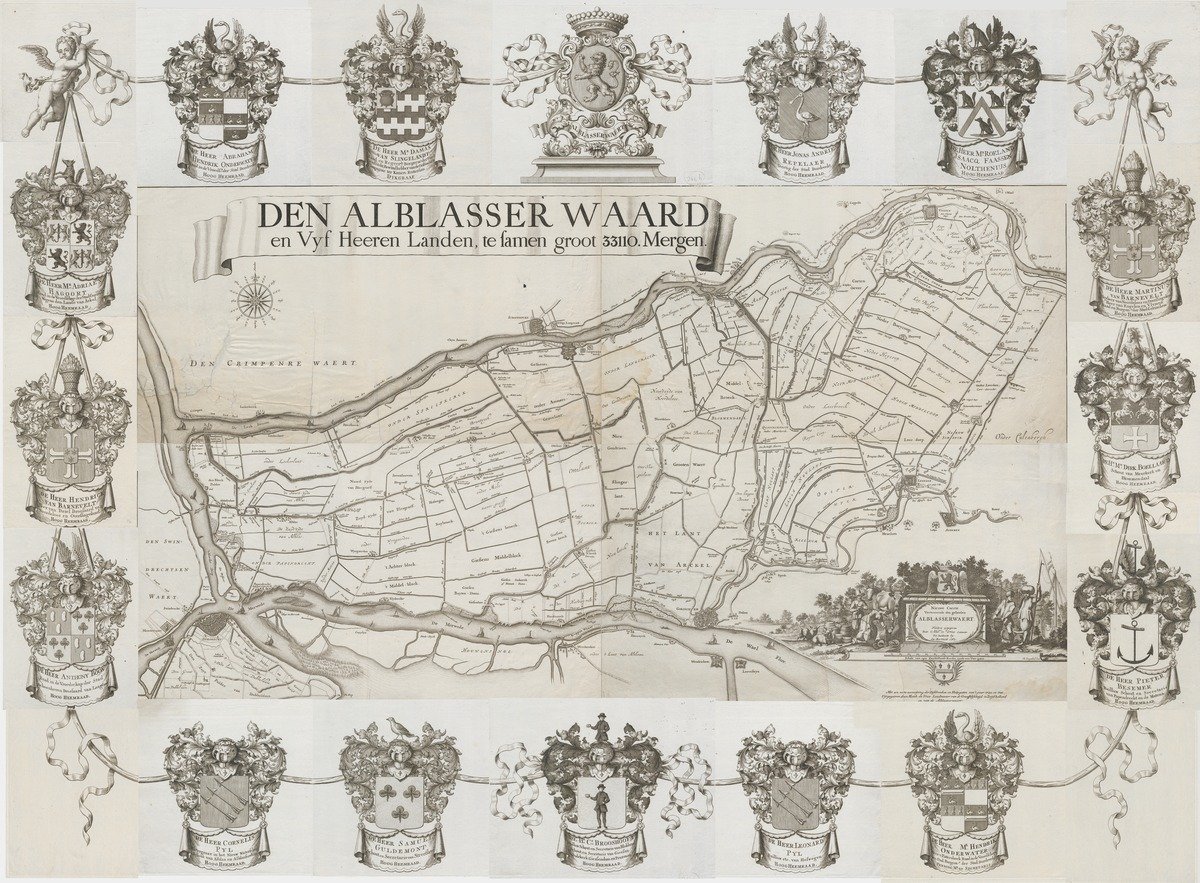
Explanation of the exhibition 'Water management maps (1600-1825)'
Nowadays water is a hot item. Especially in the Netherlands where problems with water storage are expected, due to climate change and the sea level rise. Every day sea and river dikes are being rebuilt and strengthened, and in certain areas all kinds of plans are being made to enlarge the water storage capacity.

Historical source for the landscape
Yet in the past the authorities also took active measures where water management was concerned. Old maps often testify to this fact. The collection of maps of the well-known Utrecht professor Gerrit Moll (1785-1838), which is housed in Utrecht University Library, puts a strong emphasis on hydrography. A part of this collection has now been digitized and made available in a coherent way via this digital exhibition. It gives the university library the opportunity to give access to an important source for historical research of the landscape. In addition the digitized maps are brought to life for a wider audience by an innovative link with for instance Google Earth.
The Moll collection
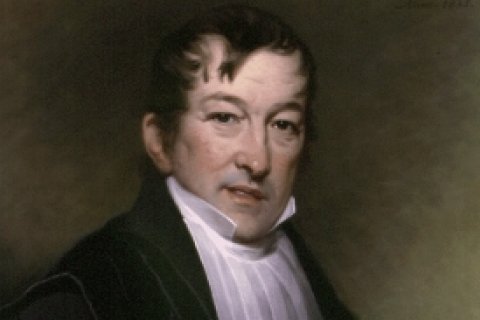
2013 is the 175th anniversary of Moll’s death. In 1812 he was appointed professor in physics and mathematics. For the purpose of teaching and research he created a large collection of documents that was bequeathed to the university library. The collection contains about 1,500 maps and a dozen atlases. It is a very versatile collection with, as said before, an important place for large-scale water district maps of mainly Dutch regions. This subject is covered by over 150 maps consisting of approximately 300 leaves of water board districts, river diversions, plans, whether executed or not, for canals and dikes etc.
A treat for the eye
The water management maps within the Moll collection are detailed and accurate and sometimes richly decorated. In this respect they are not only an important source for landscape research but also attractive to look at for a more general public. Moreover, they fit in with a current Dutch climate theme: giving water storage and rivers more room in the landscape.
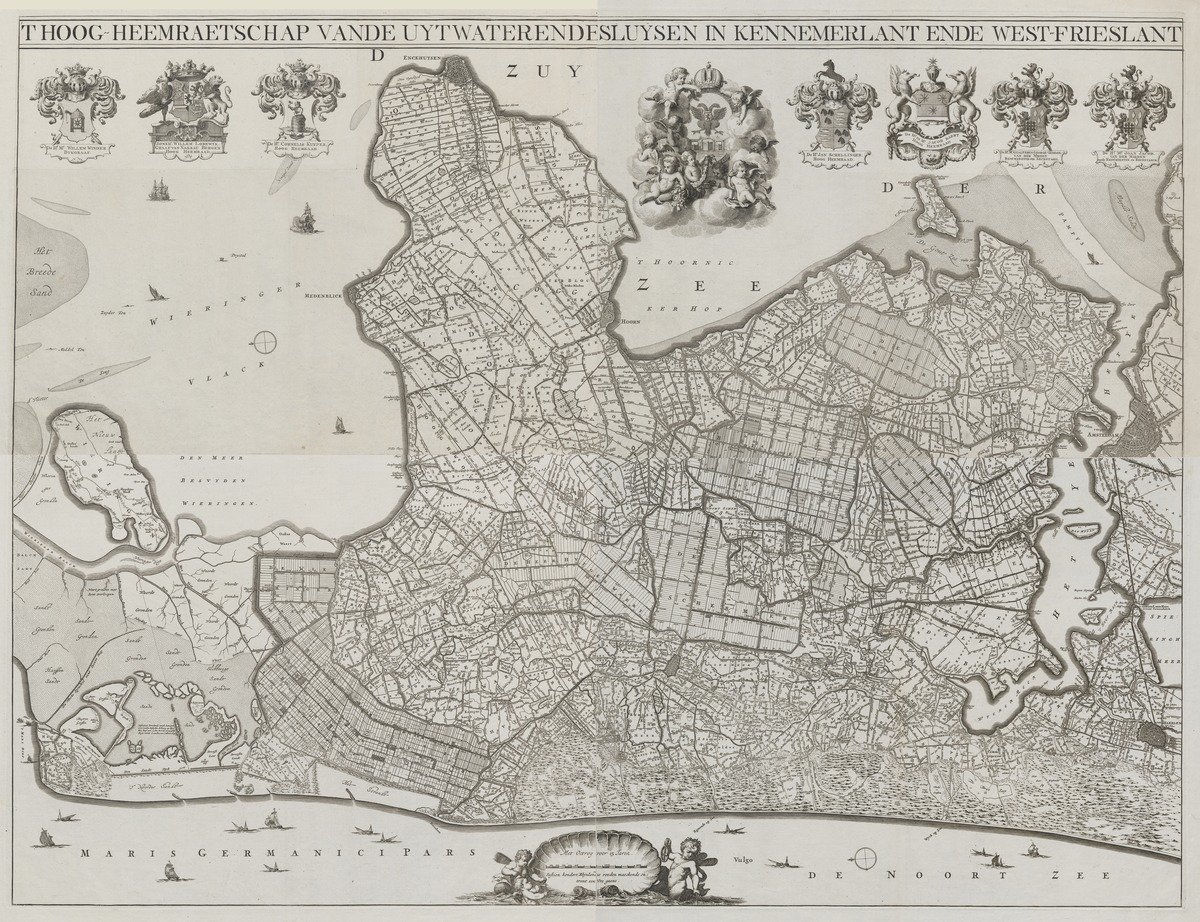
Georeferencing
Digitizing and putting water management maps online is a good thing in itself. However, the documents get an extra dimension by linking them to a geographical medium. This is called georeferencing. For the purpose of georeferencing the water management maps the application Georeferencer was used. With the help of this application coordinates can rather simply be added to scanned maps. Next the georeferenced maps can be consulted by means of a link to Georeferencer’s own viewer. It is also possible to judge the accuracy of the georeferenced map in Georeferencer.
Past and present united
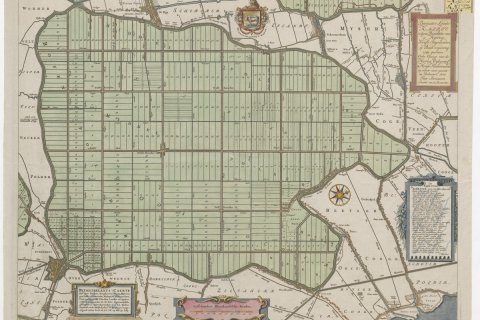
Per map the university library gives access to the scan in Georeferencer. By clicking on a map in the digital exhibition it will be shown in the viewer of the library. In the left menu you will then find links to the scan in Georeferencer (Georeferences). This application makes it possible to zoom in sharply on the map. The map can also be made transparant (tab top right) which makes a comparison with the current situation possible. Past and present shake hands …
Advantages of georeferencing
Apart from the fact that georeferenced maps are shown in modern and advanced interfaces, there are other advantages. It is for instance also possible, by opening more map layers, to pile several old maps on top of the others, thus comparing them. Moreover, new ways to analyze old maps or to link them to other spatial information are created. Last but not least georeferenced maps offer improved accessibility.

Better access to old maps: OldMapsOnline
The website of OldMapsOnline is an internet portal that gives access via a geographical interface to thousands of scans of cartographical documents, belonging to the collections of several libraries and institutions. Also Utrecht University Library has included references to its georeferenced maps in this portal. By zooming in on the world map, the underlying scanned maps of the selected framed areas are shown. By clicking on a map the website of the institution which has the original map in its collection is shown. The interactive map below (full screen for a better performance) also offers the possibility for specifically browsing the georeferenced maps of Utrecht University Library.
Lay-out
The collection of Water management maps (1600-1825) is arranged chronologically in the digital exhibition. Each map can be studied in the viewer of the library, including references to document data (title, author, scale, publisher, technique, measurements, bibliographical data etc.), the PDF of the document, library catalogue, and the georeferences. Besides, each map includes an extensive scientific explanation, outlining the context of the map. The scientific explanations are written by Dr. Marco van Egmond, curator of Utrecht University Library. The maps have been scanned in the library, and – in the case of maps consisting of several leaves – digitally assembled by Coen van der Stappen.
Realisation and subsidies
Georeferencing the collection of water magement maps in Georeferencer was done by first-year students Geo-Informatie of the Hogeschool Utrecht in 2013, under the guidance of Dr. E. Heere. This project could be realised with the subsidy for an extra module within the NWO application Vernieuwd digitaal basisbestand paleogeografie van de Rijn-Maas delta within the framework of the program MeerWaarde Aard- en Levenswetenschappen. This application was submitted by Dr. E. Stouthamer, Department of Physical Geography, Faculty of Geosciences.
Auteur
