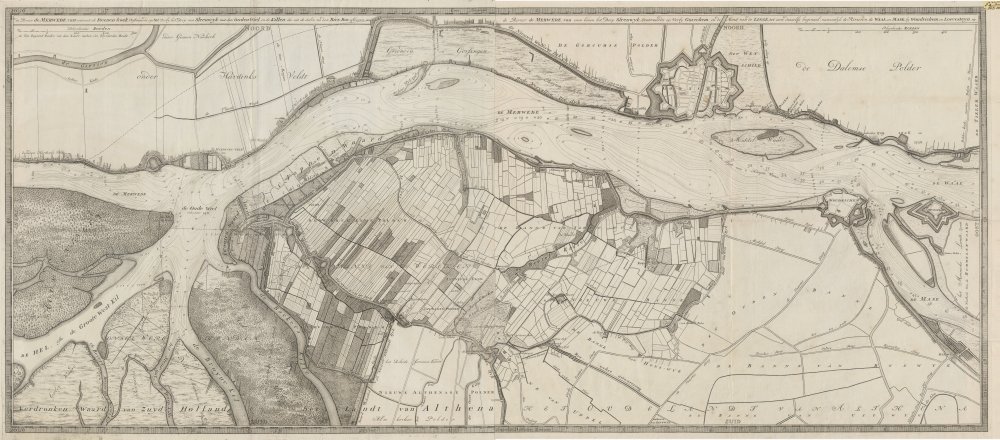
Map of the river Merwede by Cruquius
A cartographic masterpiece
It may safely be said that Nicolaas Cruquius’ map of the river Merwede between Woudrichem and Hardinxveld (1729-1730) is a real masterpiece. For the first time in the history of cartography a printed system of bathymetric contours was used. The map is also known for its beautiful engraving. However, its background is less well-known. What were the reasons behind Cruquius’ masterpiece and how should we judge the usability of the map?
Problem area
The two-sheet map shows a part of the river Merwede near the place where it flows out into the Biesbosch. For a long time, the Merwede was one of the largest problem areas in the Dutch river system. Especially after the St. Elizabeth’s Flood in 1421, when the Biesbosch was allowed to gradually develop, the hydrological situation became dangerous. Along the undiked southern banks of the Merwede the northern border of the vast Biesbosch was situated. In this area many watercourses could be found, the so-called killen, which drained off the largest part of the Merwede water via the Hollands Diep to the North Sea. In the Merwede less and less water flowed, making it difficult to keep the river deep enough.
Conflicting interests
For the ports of Dordrecht, Rotterdam, Delft, Schiedam and Brielle a good navigability of the Merwede, and downstream, of the Beneden-Maas (lower Meuse) was of the utmost economic importance. These towns did all they could to guarantee shipping traffic on both rivers via a complete or partial blocking of the Biesbosch. However, the town of Gorinchem and the water boards upstream were against closing off the Biesbosch. After all, they benefited from a safe drainage of water and ice by way of an open Biesbosch. Shutting off this drainage area without at the same time strengthening the northern river bank was non-negotiable.
Frantic efforts to solve the problem
This 18th century conflict between the five towns on the Meuse and Gorinchem is the background of the map by land surveyor Nicolaas Cruquius (1678-1754). The way in which the hydrological situation of the Merwede should be solved was constantly under discussion. Between 1726 and 1746 the States of Holland made frantic attempts to come to a solution, each time accompanied by river reports and matching maps. Cruquius’ map was made in response to the second compromise proposal from the period 1729-1734.
High water and ice masses
In February 1729 again major problems occurred, just as they did in 1726, involving high water and ice masses. Near Giessendam a large ice dam had formed, causing the Merwede to freeze over and so become inaccessible for ships. Because the Waaldijk had collapsed, the Tielerwaard had been flooded and the water had accumulated against the Lingedijk. For a short time it was feared that the events of 1726 would recur, when the dike collapsed. Fortunately, the ice dam near Giessendam started to move, so that large quantities of water and dislodged ice floes could be discharged of via the Biesbosch killen. Various dams, which were built here in 1727 and 1728, became damaged by the water and ice flows. But the water level in the Merwede dropped quickly and so the danger of collapsing dikes and flooding was over for the time being.
Plan for improvement
The town of Gorinchem was convinced that the events of 1729 showed that the killen of the Biesbosch should not be shut off without also constructing an overflow through the Land of Altena. Because the States of Holland were not convinced of the necessity of this plan, it was decided to present the proposal of Gorinchem to a team of three neutral experts, including the land surveyor Nicolaas Cruquius. They had to draw up a plan for improvement within a short period of time, but in the end it took a year to put it in writing. The report showed that the Merwede had very irregular depths. In addition there were large variations in the rate of flow. It turned out that as much as two thirds of the water mass of the Merwede flowed away via the Biesbosch.
No navigation on the Merwede?
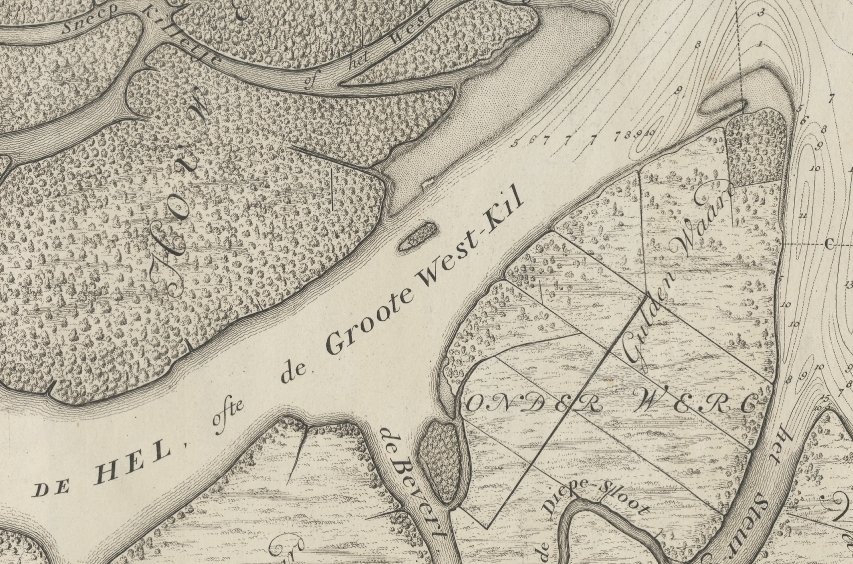
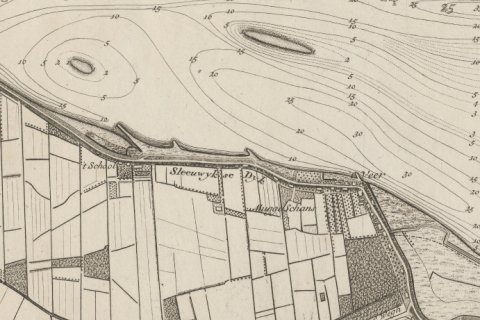
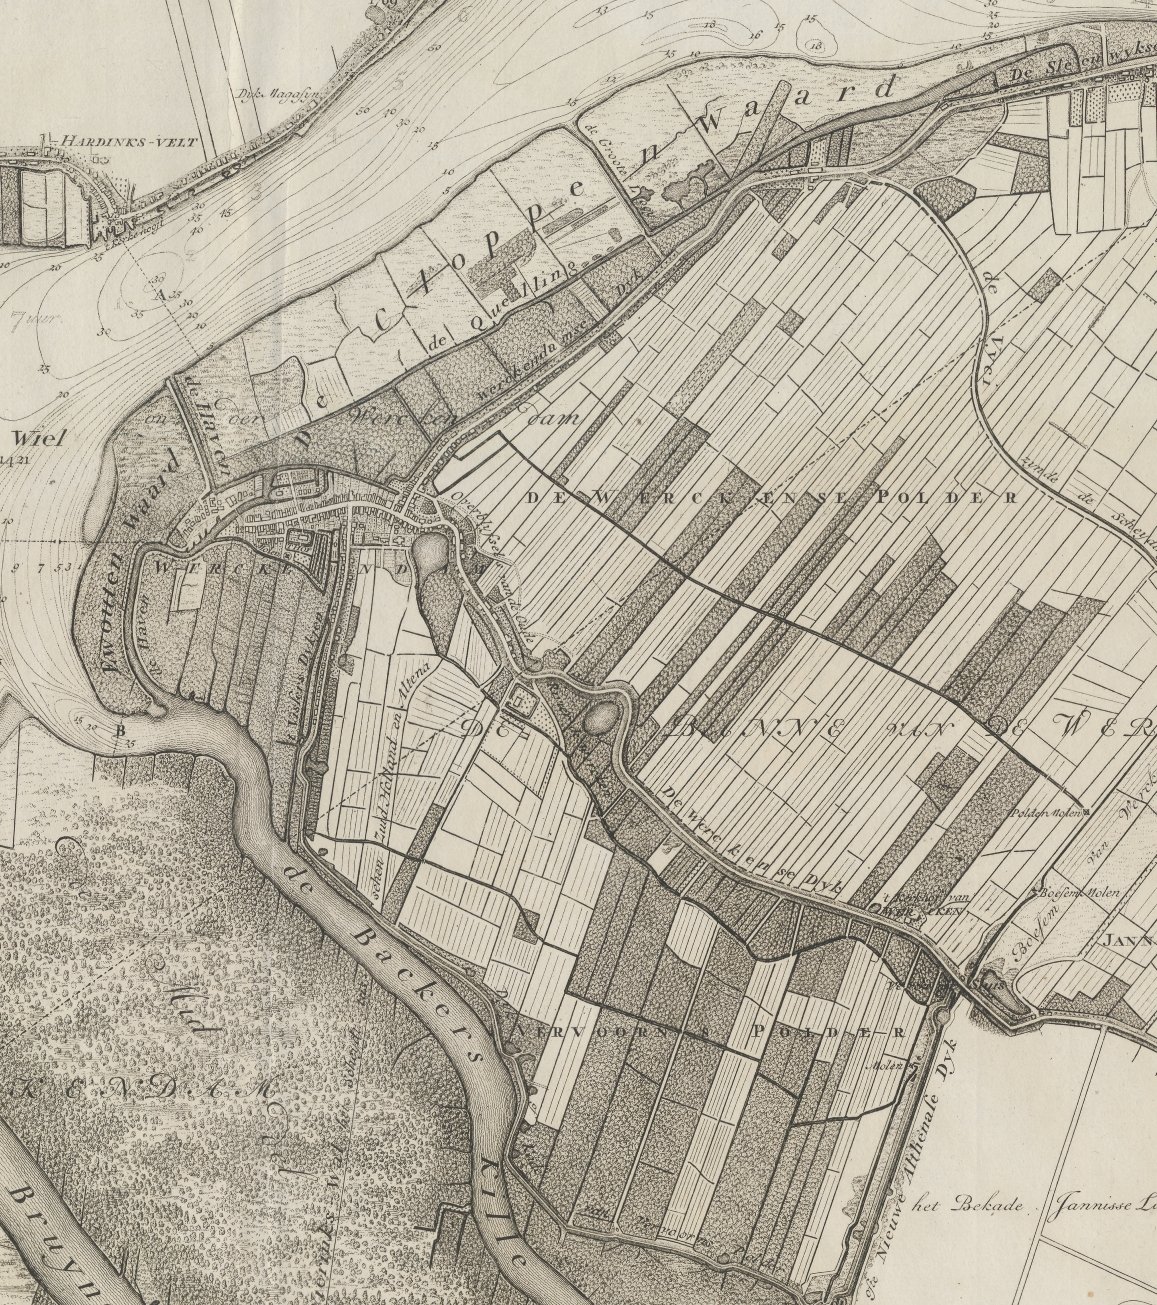
Cruquius’ map beautifully visualized the problems outlined above. You can see that near Gorinchem the water from the Meuse, the Waal – and to a lesser extent - the Linge was collected in a kind of basin. More downstream the riverbed narrowed, but here the water and the ice could spread over the salt marshes and mud-banks. Some way further down, at De Bout, the ice and water could no longer get through, often resulting in ice dams here. Furthermore, the flow of the water was hindered by the river narrowing between Werkendam and Hardinxveld, the breakwaters of the former town, the overgrowth on the water meadows and the local tide system. These factors resulted in a lot of sedimentation and that is why, the researchers concluded, the Merwede ran the risk of being no longer navigable.
Measures
Firstly, the plan for improvement was based on clearing away the obstacles in the river’s winter bed, such as shortening the breakwaters. Secondly, the plan supplied the construction of an overflow through the land of Altena or via the northern bank of the Merwede. Finally, when this overflow was finished the Oude Wiel, the large kil to the Biesbosch, should be blocked off, with an opening for the ships sailing in the direction of the local villages.
Time-consuming map
Cruquius’ river map was an integral part of the recovery plan. Making the map took a long time, over 400 working days, also as a result of the high water. Besides the two-sheet major map, Cruquius made an overview map based on existing map material. On this map two rectangles represent the area that is covered by the major map. Next the overview map shows the whole river basin of the Merwede putting the water problems in a broader spatial context. A few cross sections and diagrams with tides complete this contextual image.
Detailed
The major map by Cruquius presented here shows a detailed picture of the river then and the neighbouring areas that were important from a river-related point of view. A lot of attention is given to hydrological facilities such as sluices, dikes, bridges and pools. Also the land use is very specifically depicted, by using as many as five different surface symbols. These symbols, mostly relating to grass land, reed-land, mud-banks and orchards, are not explained on the map. For an explanation the accompanying final report must be consulted.
Closing off in phases
Despite the detailed character of the major map, of the proposed measures from the recovery plan only the outer borders are indicated by dotted lines. These measures are more noticeable on the survey map mentioned before. We can see, however, that in particular the overflow area in the Land van Altena is mapped with a higher density. This is in contrast to the projected overflow area via the northern bank which was clearly less popular with the experts. By accentuating the southern overflow so heavily and also by each parcel, it became immediately clear whose lands would flood when using the overflow. Probably Cruquius wanted to show that a phased closing off of the Oude Wiel was the best solution, saving as much water as possible for the Merwede.
System of bathymetric contours
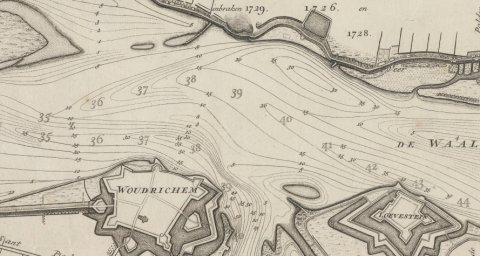
Another striking feature of this map is the system of bathymetric contours in the river. That is why the map is internationally renowned, because for the first time in history such a system of bathymetric contours was applied on a printed map. Already before this time a few contours had occurred in maps, but Cruquius was the first to bring the so-called isolines method in practice to link up a complex of bathymetric contours. Starting point was a series of lines of direction, at right angles to the bank, along which, by means of long stakes, the depth was determined (in feet deep below low tide). Based on these data the system of bathymetric contours was drawn in the map by interpolation. In doing so, Cruquius made a few mistakes. On an isoline map the lines cannot branch out, but we see this happen a few times on his map. For instance to the northwest of Loevestein, directly above the number ‘38’.
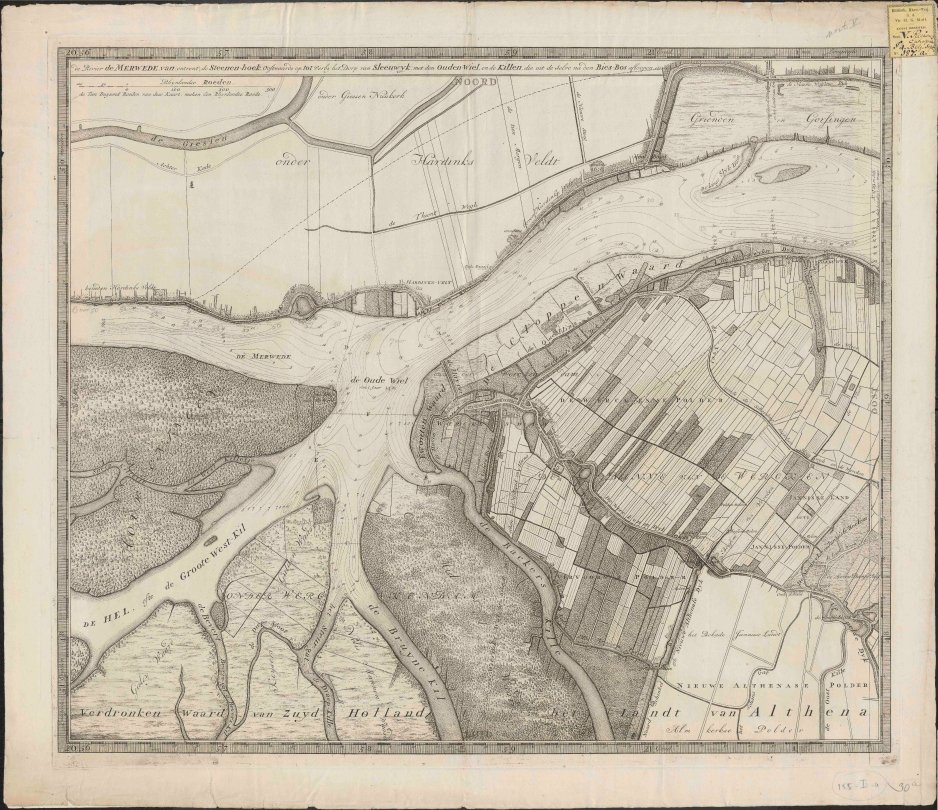
Separate map sheets
Although the major map consists of two sheets that can be mounted, it is possible to view both sheets as loose maps: after all they have separate titles. The map sheets were engraved by David Koster. The printed map by Cruquius was an appendix to the resolution of 12 July 1730 regarding Rapport van de professoren ’s-Gravesande en Wittichius, en van de landmeeter Cruquius, wegens haare gedaane inspectie van de Rivier de Merwede van Gorinchem af beneederwaarts, en wegens de voorgeslaage middelen tot voorkoming van inundation (‘Report of the professors ‘s-Gravesande and Wittichius, and of the land surveyor Cruquius relating to the inspection done of the river Merwede downstream from Gorinchem and relating to the proposed means to prevent inundations’).
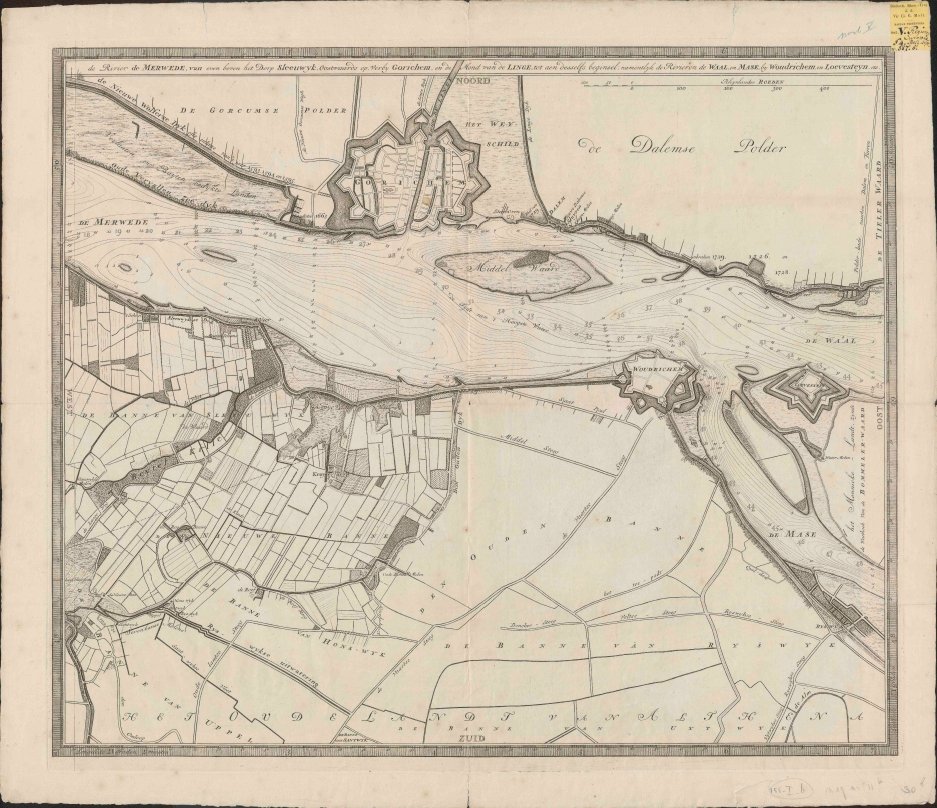
Laborious compromise
The final report mentioned above with its accompanying maps was presented to the States of Holland in July 1730. The differences between Gorinchem and the five Meuse towns resulted in a laborious compromise only to be reached in September 1730. This involved that no overflow was to be constructed and also that the Oude Wiel would not be blocked off. What eventually remained of the recovery plan was just the clearing of the river bed and only to a limited extent at that. Despite this lack of rigourous hydrological measures we at least still have the cartographic masterpiece left by Cruquius to enjoy!
Author
