Focus on the rocky floor under the Antarctic ice sheet
Sharper image of bedrock on which the ice sheet rests improves forecasts of future loss of mass
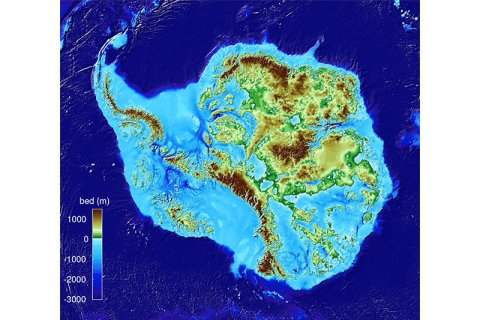
The ice sheet of Antarctica contains enough ice to make average sea levels rise by more than 55 meters. An incomplete image of the bedrock, the rocky floor under the ice sheet, makes predictions about future ice loss and the resulting sea level rise extremely uncertain. A new method published this week in Nature Geoscience provides a much clearer picture of the bedrock. The study’s findings resulted from a collaboration with researchers from Utrecht University.

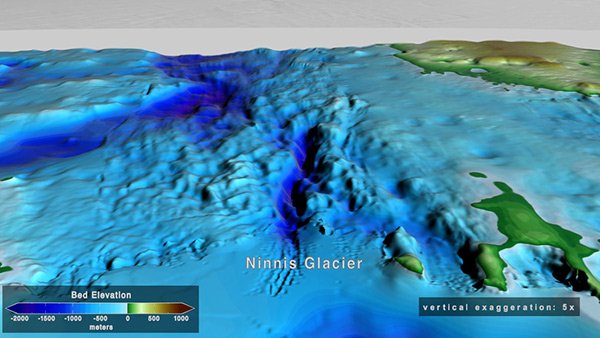
The Antarctic ice sheet loses around 200 cubic kilometres of ice each year, and is well on its way to surpassing the Greenland ice sheet as the main source of sea level rise. The future loss of mass will largely be determined by the depth and slope of the bedrock under the ice. A bedrock situated below sea level that slopes deeper going inland could result in an irreversible retreat of the ice sheet, but for 85% of Antarctica, scientists are unsure as to how deep the bedrock lies. Only powerful radar systems can penetrate the kilometres-thick layer of ice, and only a handful of short-range scientific research aircraft are equipped with these radars.
Intelligent use of information
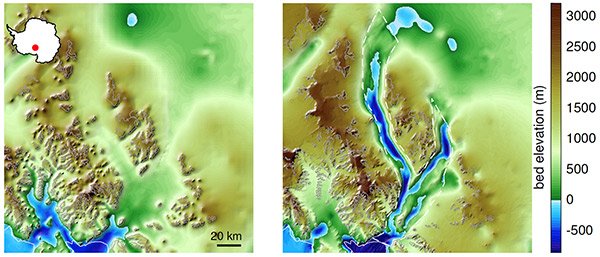
Nevertheless, thanks to a new technique applied to their measurements, researchers have now managed to obtain a much clearer image of the Antarctic bedrock. Instead of simply interpolating the available radar data, the new method makes intelligent use of additional information: detailed satellite images of the speed of the ice sheets’ movements and the results of models of snowfall on the ice sheet surface. The height of the surface of the ice has been measured to a high degree of accuracy, so if the mass of the ice between the lines of aircraft measurements is constant, the scientists can calculate the thickness of the ice at any point, and therefore the depth of the bedrock as well.

Focusing in
“It’s like focusing in on what had once been a fuzzy image”, says Melchior van Wessem, researcher at the Institute for Marine and Atmospheric Research Utrecht (IMAU) and person responsible for calculating the amount of snowfall. “Deep valleys carved by glaciers suddenly appear where they had once been invisible.”
“This new knowledge will significantly improve our ability to predict future loss of mass from the ice sheet”, says co-author Michiel van den Broeke, also affiliated with the IMAU. “That will be vital for the new Netherlands Knowledge Programme Sea Level Rise that started this year, in which Antarctica will play a crucial role.”
Publication
Deep glacial troughs and stabilizing ridges unveiled beneath the margins of the Antarctic ice sheet
Nature Geoscience, 12 December 2019, DOI 10.1038/s41561-019-0510-8


