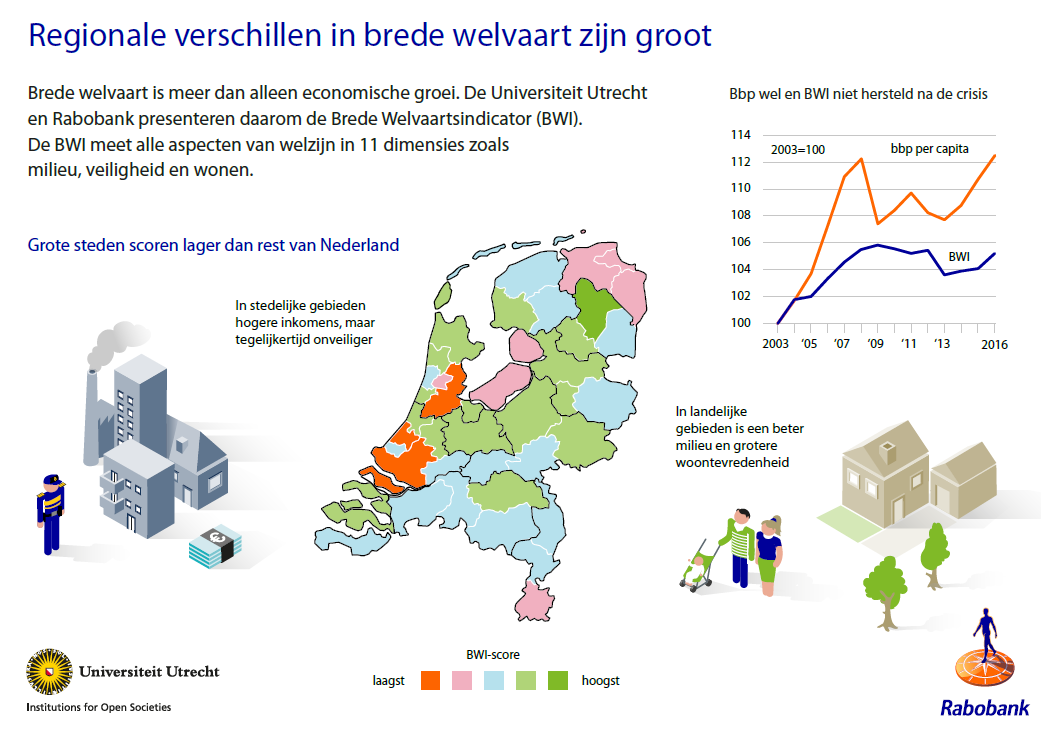
Comprehensive wellbeing is lagging despite economic growth
Big regional differences within the Netherlands
The economic growth is still not expressed in an equal rise of comprehensive wellbeing for Dutch households. While the Gross Domestic Product (GDP) per capita already returned to its pre-crisis level in 2016, this is not the case for comprehensive wellbeing. There are also big differences within the Netherlands in terms of comprehensive wellbeing between regions.
This is shown in the Comprehensive Indicator of Wellbeing (Dutch name: Brede Welvaartsindicator, BWI) 2017 of Utrecht University and Rabobank that was presented today. This indicator is an integral gauge that provides insight on the development of broad prosperity in the Netherlands since 2016.

Unlike the GDP per capita, the BWI measures and assesses not only the economic situation, but also other factors such as unemployment, job security, education, health, the environment, housing, safety and happiness. What is extra special for this year is that the BWI shows the differences between the Dutch regions for the first time. This showed a wide range of diversity. Among other things, this showed that comprehensive wellbeing in urban areas is lower than in rural areas.
INTEGRAL INSIGHT ON COMPREHENSIVE WELLBEING
Until now, the concept of GDP per capita was often used to measure the prosperity of people. But the GDP per capita gives a one-sided image because prosperity is not just expressed by the financial situation. The GDP often indicates that the national economy is growing, but this growth is not seen in the prosperity of households. This is also shown in the BWI 2017: comprehensive wellbeing and economic growth in the Netherlands clearly run different courses (Image 1). What stands out is that while the GDP per capita already returned to its pre-crisis level in 2016, this is not the case for the BWI. In other words, comprehensive wellbeing has not yet fully recovered from the crisis.
The GDP per capita does not by definition say anything about the development of comprehensive wellbeing.
“The further and further growing apart of economic growth and comprehensive wellbeing clearly indicates that the GDP per capita does not by definition say anything about the development of comprehensive wellbeing. We hope policy makers in the Netherlands take this to heart and will make decisions based on the total picture,’’ says Bas van Bavel, professor of Transitions of Economy and Society at Utrecht University.
DEVELOPMENT BWI 2017
The BWI measures (for the period 2003- 2016) 11 dimensions that index the comprehensive wellbeing of Dutch people. If we look at the development of the dimensions in the past thirteen years, it turns out that the different dimensions developed very differently. The dimensions labour and housing have gone down significantly due to the rise in unemployment, the increased flexibilisation of the labour market and the lower housing satisfaction. On the other hand, the dimensions health, safety and environment have increased significantly. Life expectancy has increased, violent crime has gone down and the emission of particulates has decreased significantly.
REGIONAL INSIGHT
Due to decentralisation of government tasks to municipalities in 2015, life-altering decisions are taken more and more on a regional level. The Coalition Agreement 2017-2021 also underlines this with its geographical distribution of investments. This year, the BWI shows for the first time the differences between the Dutch regions. This makes the BWI a good starting point for policy makers to handle regional bottlenecks.
LOWER COMPREHENSIVE WELLBEING IN URBAN AREAS THAN IN RURAL AREAS
The regional differences in the Netherlands are big (see map Figure 1) “What stands out is that a higher urbanisation generally accompanies a lower comprehensive wellbeing. The three largest cities Amsterdam, Rotterdam and The Hague even have the lowest comprehensive wellbeing in the Netherlands,” says Martijn Badir, an economist at Rabobank. The lower comprehensive wellbeing in big cities is primarily caused by a low housing satisfaction and higher unsafety. The more rural regions are generally doing a lot better. The areas with the highest comprehensive wellbeing are North and Southwest Drenthe and the Gooi.

